ATT: 6 months after its release, what impact for the App Tracking Transparency?

Six months ago, Apple imposed App Tracking Transparancy on all application publishers. A revolution in mobile advertising. As it is a new way of tracking users, with an option for restricted targeting on iOS, many advertisers were scared off without really knowing where to start.
After our first evaluation, 1 month after ATT was launched, let’s look over it with a little more hindsight.
The entier iOS population had adopted iOS 14.5 or later
According to Branch or Appsflyer, the adoption rate is between 75 and 90%. We can consider that the entire population is using a version of iOS that supports APP. Those who have not yet updated their device, who will do so for a future version, who will never do it or who are unable to do it because their device is too old.
Having run specific campaigns since the implementation of Apple’s ATT Framework, we have noted that 65% of the budgets dedicated to iOS on our campaigns concern the SKAdNetwork. A percentage that follows the adoption trend.
A significant impact on Android campaigns, an opportunity to be taken on iOS
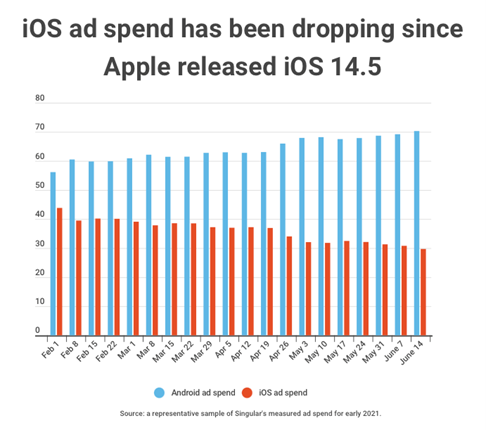
App Tracking Transparency has had an impact on the performance of Android campaigns as advertisers have massively shifted their budget to Android and decreased their spending on iOS. The effect of this increased competition has been a significant increase in the CPM on Google’s OS, therefore degrading the overall performance of campaigns by contributing to an increase in CPI.
In our campaigns, for all sources and all countries, we note an increase of 12% for CPM on Android between May and July.
On the other hand, the CPM on iOS is decreasing because the SKAdNetwork traffic is sold at a lower price by the sources and there is less and less competition due to a switch in spending towards Android. As for us, we see a decrease of -47% for the iOS CPM.
This shift can be seen in the graph below, taken from an article in Singular.
A higher than expected IDFA rate
Early estimates put the rate of users with IDFA at between 10 and 15%. We are talking here about opt-in firstly from the application and secondly from the source that broadcasts the campaigns (double opt-in).
However, the latter would ultimately be higher. At Addict Mobile, we see double opt-in rates between 25 and 40%, while other players such as Branch or AppsFlyer talk about an average of 21%.
The difference between these rates may seem small, but this has a real impact on performance measurement. Having 10-15% more installations with an IDFA makes it easier to build on these results to make projections about the performance of opt-out users.
Choose the right view to optimize your campaigns
Since opt-in users or <iOS 14 users continue to come up on your tracking tool in the usual way, you can choose to continue watching these performances directly on your usual MMP or on the SKAdNetwork.
But how do we know where and how to check the performance?
It’s not a question of improvisation. Depending on the mechanics of your app, the type of sources you activate, your objectives or the opt-in/opt-out distribution of your users, the data source you choose to calculate your performance will not be the same. Except for Apple Search Ads which is a special case because the attribution is done by the AdServices API which is already integrated in the different MMPs.
To make this choice you can base your decision on the following indicators:
- Post-print attribution share from the source: If the share of installations attributed through post-print is high then it will be better to use the data attributed by the MMP as the SKAdNetwork only captures a very small portion of these installations (the ad has to stay on the screen for 3 seconds for the impression to be counted). The impact of losing post-print on performance is sometimes far greater than losing some of the click attribution.
- IDFA rate: The distribution of facilities with and without IDFA is very important when choosing how to look at performance. Indeed, if your opt-in rate is high your performance should not have changed much since the release of iOS 14.5+. In this case, you can continue to rely on the MMP data without paying much attention to the SKAdNetwork data. Otherwise, if the number of installations attributed to IDFA on your campaigns is very low, your main KPIs will go downwards due to lack of visibility so the data reported by the SKAdNetwork will be more meaningful.
- Beware of the Privacy Threshold: This is the minimum installation threshold below which Apple decides not to send you the event data generated by your SKAdNetwork campaigns. Apple believes that with only a few installations per day, the advertiser would be able to identify users by cross-checking actions made within the app, which would go against the privacy policy of the brand.
Depending on the volume of installations you generate each month, it makes more sense to analyse your campaign data on the MMP or via the SKAdNetwork
- If you do not generate many monthly installations, you will probably be below the privacy threshold so:
– No events with SKAdNetwork
– The MMP will only report events from users who have opted-in
- If you generate a lot of installations per month, you will probably be above the privacy threshold so:
– Events will be reported to the SKAdNetwork for both opt-in and opt-out users. You will be able to optimize using this data only.
– About the MMP: Only the events of opt-in users, so technically less data (except for other factors that are mentioned before and after)
Create a performance estimation model
Seeing as attribution and tracking have evolved, it is important to have attribution models that allow you to evaluate the actual performance of your campaigns.
To do so, we need to take two steps. Estimate the number of installations that are not tracked by your tracking solution:
– Share of users who have opted-out and do not go back to the MMP
– Share of installations generated in post-print that do not go back to the SKAdNetwork
Also, estimate the quality of these missing facilities by calculating a LTV based on the data you have (organic traffic, iOS installs still allocated, Android data, historical data of both OS, etc.).
By combining these 2 estimates you can estimate the value of the installations and make more precise projections about the performance of your campaigns.
You can go even further in the data used by taking into account the seasonality, the disparities between the OS, the variation of installs etc… The more the data history is large the more the calculation can be refined.
If you broadcast high volume campaigns and you want a helping hand to master the iOS 15 environment, do not hesitate to contact us for a free audit of your campaigns.
NEWS
Article in relation

Retargeting vs Remarketing: What’s the Difference and Which…
Most users don’t convert during their first interaction with a brand. According to the Baymard Institute, the average cart abandonment rate exceeds 70%,...
Published on 29 June 2026
The Third Pillar: Where OEM Advertising Fits in…
– by Ashwin Shekhar, Co-Founder & CRO at AVOW The list of channels in a mobile UA (user acquisition) brief looks almost identical...
Published on 23 June 2026
Why Performance Marketing Without Brand Investment Ends Up…
The split between branding and performance budgets refers to how marketing investments are allocated between brand awareness campaigns and performance campaigns. In 2026,...
Published on 9 June 2026