Cost Per Install (CPI): A Key Metric to Optimize Mobile Acquisition
Introduction
CPI (Cost Per Install) is a crucial metric in mobile user acquisition. It measures the average amount an advertiser pays to get a user to install their app via a specific ad campaign. It’s one of the most widely used KPIs in UA (User Acquisition) because it allows for a quick assessment of campaign profitability and helps fine-tune advertising strategies.
But how do you calculate CPI? What factors impact it? And how can you optimize it without sacrificing user quality? This article breaks down everything you need to know about CPI and its role in mobile marketing.
Définition et calcul du coût par installation (CPI)
Le CPI (Coût par installation) est un modèle de tarification utilisé en publicité mobile. Il représente le montant qu’un annonceur paie à un éditeur ou à un réseau publicitaire chaque fois qu’un utilisateur installe l’application après avoir interagi avec une publicité spécifique.
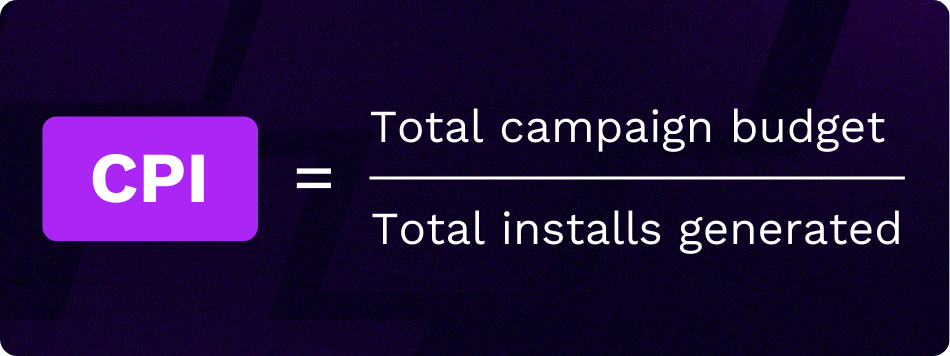
Formule du CPI
Le coût par installation est calculé en divisant le budget total dépensé pour une campagne publicitaire par le nombre total d’installations générées par cette campagne.
Exemple de calcul
- Dépenses publicitaires totales : 5 000 €
- Nombre d’installations générées : 2 500
- CPI = 5 000 / 2 500 = 2 €
Un CPI trop élevé peut impacter la rentabilité d’une acquisition et nécessiter des ajustements dans les stratégies marketing. À l’inverse, un CPI trop bas peut parfois refléter une acquisition d’utilisateurs de moindre qualité (faible engagement, taux de rétention bas, etc.)
Quels sont les facteurs qui influencent le CPI ?
Le coût par installation n’est jamais une donnée fixe. Il varie en fonction de plusieurs paramètres : marché, plateforme, type d’application, mais aussi période de l’année. Comprendre ces éléments permet d’anticiper les fluctuations et d’optimiser les campagnes en conséquence.
Pays et régions
Le CPI dépend fortement du marché ciblé. Dans les pays où la concurrence est élevée et le pouvoir d’achat important (États-Unis, Europe de l’Ouest), les enchères sont plus fortes, ce qui fait grimper les coûts d’acquisition. À l’inverse, dans des régions comme l’Amérique latine ou l’Asie du Sud-Est, le CPI est souvent plus bas en raison d’une moindre saturation publicitaire et d’un pouvoir d’achat plus faible.
Exemple de benchmarks CPI par région
- Amérique latine : $0.50 – $2.00
- Amérique du Nord : $2.50 – $5.00
Source : Business of Apps
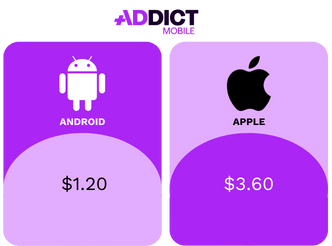
OS (iOS vs Android)
Le CPI varie aussi en fonction de l’OS. iOS est généralement plus cher qu’Android car les utilisateurs y sont considérés comme plus rentables et les annonceurs sont plus nombreux à vouloir les toucher. Cela dit, le coût diffère selon les marchés et les segments d’utilisateurs.
Source : Appsflyer
Verticale de l’application
Chaque catégorie d’applications a des coûts d’acquisition différents. Un jeu hypercasual aura un coût par installation plus bas grâce à son large volume d’utilisateurs et son acquisition massive. À l’inverse, une app fintech ou de rencontre cible un public plus spécifique, souvent plus difficile à convertir, ce qui fait grimper le coût d’acquisition.
Source d’acquisition
Le choix de la plateforme publicitaire a un impact direct sur le CPI, mais pas toujours de façon uniforme. Certains réseaux très sollicités comme Meta et Google Ads affichent souvent des CPIs élevés en raison de la forte concurrence. D’autres plateformes peuvent offrir un coût d’acquisition plus bas, mais cela dépend du type d’audience et du niveau de précision du ciblage.
Exemples de coût par installation moyens par source publicitaire
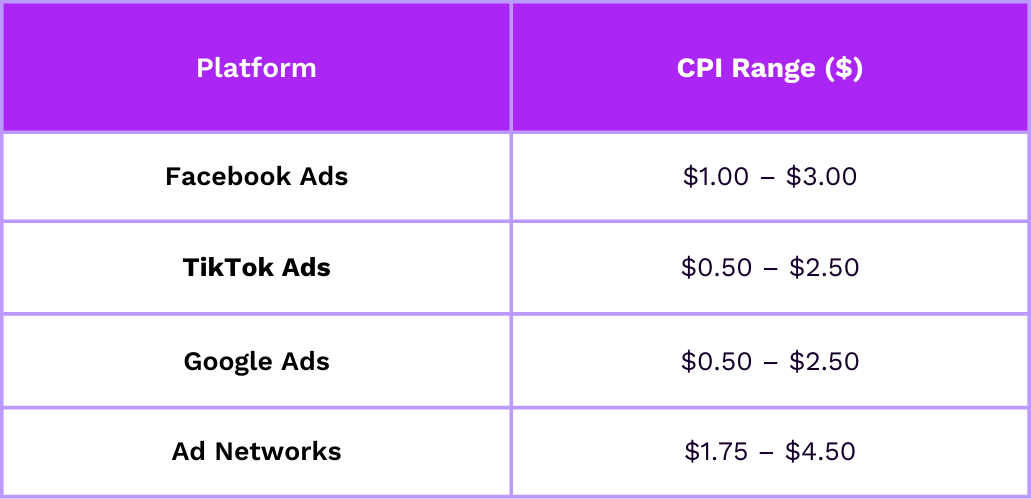
Source : Business of apps
Saisonnalité
Le CPI n’est pas stable tout au long de l’année. Pendant des périodes comme le Black Friday, Noël ou les soldes, la concurrence explose et les enchères grimpent. À l’inverse, des périodes plus creuses comme l’été voient souvent des CPIs plus bas, car moins d’annonceurs sont actifs.
CPI vs autres KPIs en user acquisition
Le CPI seul ne suffit pas à mesurer la rentabilité d’une stratégie d’acquisition. Il doit être analysé en parallèle d’autres KPIs pour une vision complète des performances des campagnes.
CPI vs CPA (Coût par Action)
Le CPA mesure le coût d’une action post-install, comme une inscription, un ajout au panier ou un achat. Contrairement au CPI, qui s’arrête à l’installation, le CPA permet de savoir si les utilisateurs acquis sont réellement actifs et engagés dans l’application.
Pourquoi c’est important ?
- Un CPI bas peut être trompeur si les utilisateurs n’effectuent pas d’actions post-install.
- Un CPI élevé peut être justifié si les utilisateurs ont une forte propension à convertir.
Exemple :
- Une app e-commerce affiche un CPI de 3€ et un CPA (premier achat) de 15€.
- Elle optimise ses campagnes et réduit son CPI à 1,5€, mais son CPA passe à 30€.
- Résultat : le coût d’acquisition d’un acheteur double, ce qui rend la campagne moins rentable.
CPI vs ROAS (Return on Ad Spend)
Le ROAS mesure le revenu généré par rapport aux dépenses publicitaires. Un coût par installation faible ne garantit pas un bon ROAS si les utilisateurs n’effectuent pas d’achats ou génèrent peu de valeur après l’installation.
Pourquoi c’est important ?
- Un CPI bas ne suffit pas si les utilisateurs n’achètent pas après l’installation.
- Un CPI plus élevé peut être rentable si les utilisateurs dépensent plus dans l’application.
Exemple :
- Une app gaming investit 10 000€ pour 5 000 installations (CPI de 2€).
- 10% des utilisateurs font un achat in-app, générant 15 000€ de revenus.
- ROAS = 1,5 (soit un ROI de +50%) → La campagne est rentable malgré un CPI plus élevé.
CPI vs LTV (Lifetime Value)
Le LTV mesure la valeur totale qu’un utilisateur génère sur toute sa durée de vie dans l’application. Comparer le CPI au LTV permet de juger si une acquisition est réellement rentable sur le long terme.
Pourquoi c’est important ?
- Si le CPI dépasse le LTV, la campagne est déficitaire.
- Si le CPI reste inférieur au LTV, elle est rentable et peut être intensifiée.
Exemple :
- Une app de streaming acquiert des utilisateurs à 4€ de CPI.
- Ces utilisateurs génèrent un LTV moyen de 12€ sur six mois.
- Résultat : la marge est suffisante pour justifier l’investissement publicitaire.
Comment réduire son CPI tout en maintenant la qualité des utilisateurs ?
Réduire le coût par installation sans compromettre la qualité des utilisateurs est un enjeu clé en user acquisition. L’objectif ? Obtenir des installations rentables, pas juste moins chères.
Voici quelques approches :
1. Travailler et tester les créas publicitaires
Les créas ont un impact direct sur le coût par installation. Une publicité bien conçue capte l’attention, améliore le taux de conversion et réduit le coût par installation.
- Tester plusieurs formats : vidéos courtes, UGC (User Generated Content, carrousels etc.
- Optimiser les CTA pour maximiser les clics.
- Multiplier les A/B tests pour identifier les visuels les plus performants.
Pour en savoir plus, découvrez notre article sur le Creative Testing
2. Optimiser le ciblage publicitaire
Un ciblage trop large génère des volumes inutiles, trop précis fait grimper le coût par installation. L’enjeu est d’équilibrer qualité et volume.
- Exploiter les audiences lookalike pour toucher des profils similaires aux meilleurs utilisateurs.
- Exclure les segments peu performants pour éviter le gaspillage budgétaire.
- Ajuster en fonction des données disponibles (device, zone géographique, habitudes d’usage).
3. Optimiser l’ASO (App Store Optimization)
Un bon ASO booste la conversion sur les stores et réduit mécaniquement le coût par installation.
- Travailler les fiches produit : titre, description et mots-clés pour améliorer la visibilité.
- Optimiser les visuels : icône, captures d’écran et vidéos influencent le taux d’installation.
- Encourager les avis et notes positives pour renforcer la crédibilité et la conversion.
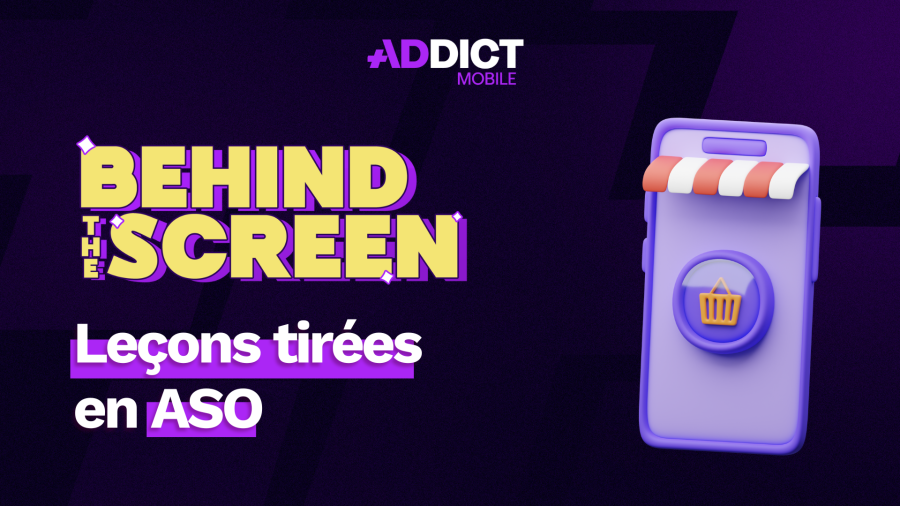
Leçons tirées en ASO
Découvrez comment nous avons accompagné un jeu mobile améliorer son classement et ses taux de conversion sur les stores.
4. Diversifier les sources d’acquisition
Ne pas dépendre d’un seul canal permet de répartir les risques et optimiser les coûts.
- Tester plusieurs plateformes : Meta Ads, Google Ads, TikTok, DSPs…
- Explorer de nouveaux formats : stories, rewarded videos, in-app ads…
- Analyser et ajuster en continu : le meilleur canal aujourd’hui ne le sera peut-être plus demain
Conclusion
Le coût par installation est un indicateur clé en acquisition mobile, mais il ne suffit pas à lui seul pour juger de la rentabilité d’une campagne. Pour être efficace, il doit être optimisé sans compromettre la qualité des utilisateurs acquis. Visuels performants, ciblage précis, ASO optimisé et diversification des canaux sont les leviers essentiels pour maintenir un bon équilibre entre coût et valeur. L’enjeu n’est pas seulement de réduire le CPI, mais de s’assurer que chaque euro investi génère des utilisateurs réellement engageants et rentables.

Do not hesitate to contact with our teams
Addict can support you to improve your performance.