ARPU: Understanding and Maximizing the Value of Your Average User
Introduction
ARPU, or Average Revenue Per User, is a key metric for companies operating in the field of mobile applications and digital marketing. This page will explain in detail what ARPU is, why it’s essential in mobile marketing strategies, and how to use it to optimize your campaigns.
What is it?
ARPU is a KPI that represents the average revenue generated by an active user over a given period. It is calculated as follows:

This data is generally expressed monthly or annually. It provides an understanding of average profitability per user, whether for a free application with integrated purchases, a subscription-based service or an advertising-financed application.
What is it used for?
- Evaluate application performance: this KPI allows you to compare the average revenue generated per user between different campaigns, periods or audience segments.
- Budget planning and forecasting: By understanding it, you can better estimate the return on investment (ROI) of advertising campaigns and marketing initiatives.
- Compare different monetization strategies: Whether you opt for subscriptions, advertising, or integrated purchases, ARPU helps you determine which approach is most profitable.
- Prioritize marketing efforts: Users or segments that generate high ARPU can receive more attention and resources to maximize their engagement.
Why advertisers need to take it into account in their mobile marketing strategies
- Optimize UA (User Acquisition) campaigns: By identifying the channels and campaigns that attract users with high ARPU, advertisers can allocate their budgets more effectively.
- Improve Lifetime Value (LTV): this KPI is often used to calculate LTV, an essential metric for determining the viability of your advertising spend and acquisition strategies.
- Refine audience segmentation: Advertisers can analyze ARPU by segment to better understand which user groups offer the most value, and adjust their messages accordingly.
- Negotiating with advertising platforms (DSPs): Knowing your ARPU enables you to better set your cost-per-acquisition (CPA) targets and optimize your advertising bids.
- Measuring the success of creative optimizations: An improvement in ARPU after A/B testing or campaign adjustments can indicate that your strategy is on the right track.
Our best practices for increasing your ARPU
- Diversify your revenue sources: Combine monetization models (integrated purchases, subscriptions, advertising) to maximize value per user.
- Personalize the user experience: Propose offers and recommendations tailored to user preferences.
- Improve retention: The longer users stay active, the more revenue they generate. Work on long-term engagement through innovative features and rewards.
- Test and iterate your campaigns: Use tracking tools to understand what works and what doesn’t.
- Collaborate with DSPs: Good management of advertising campaigns on these platforms can generate quality users, which has a positive impact on your indicator.
Which KPIs should be used to track ARPU?
To complement your analysis, several KPIs are relevant, but Lifetime Value (LTV) stands out as an essential metric. Here’s why and how it differs from ARPU.
1. Lifetime Value (LTV) : Une vision à long terme
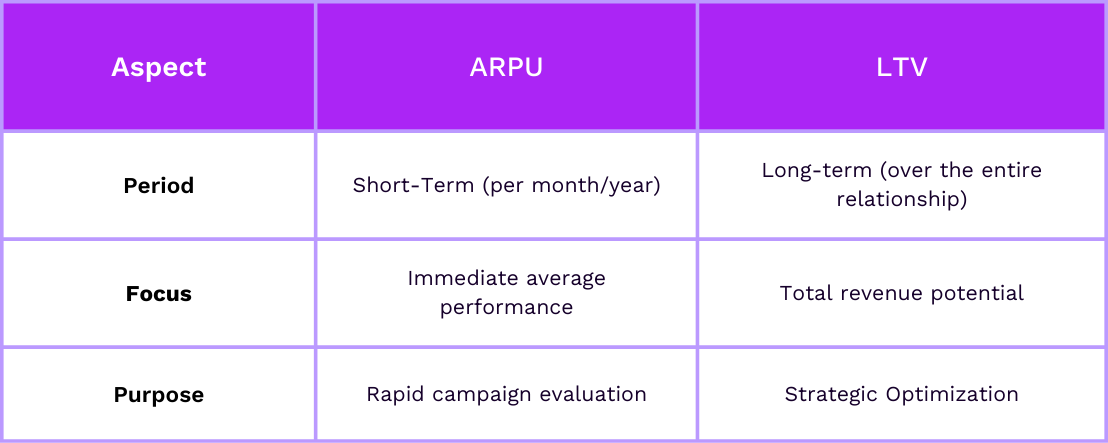
Lifetime Value is the total revenue expected from a user over the duration of their relationship with your application or service. Unlike ARPU, which measures average revenue over a given period, LTV takes a long-term approach, including :
- User retention: the length of time a user remains active on the app.
- Transaction frequency: how often a user makes purchases
- Future revenue increases: upsell and cross-sell opportunities.
Why link it to ARPU?
- Predicting long-term profitability: ARPU shows immediate performance, while LTV reveals whether a user segment is really profitable over the long term.
- Optimizing acquisition costs: If your LTV is higher than your cost of acquisition (CAC), your campaigns are viable.
- Strategic planning: with LTV, you can anticipate the resources needed to increase user value over the long term.
Main differences with LTV :
2. Retention rate: User loyalty and quality
The retention rate measures the proportion of active users who return over a given period (day 1, day 7, day 30).
Why link it to ARPU?
- Good retention amplifies the impact of ARPU. If users stay active longer, they generate more revenue, thus increasing their LTV.
- If the indicator is high but retention is low, this may indicate a dependence on one-off transactions or less loyal users.
3. Customer Acquisition Cost (CAC): Profitability of advertising campaigns
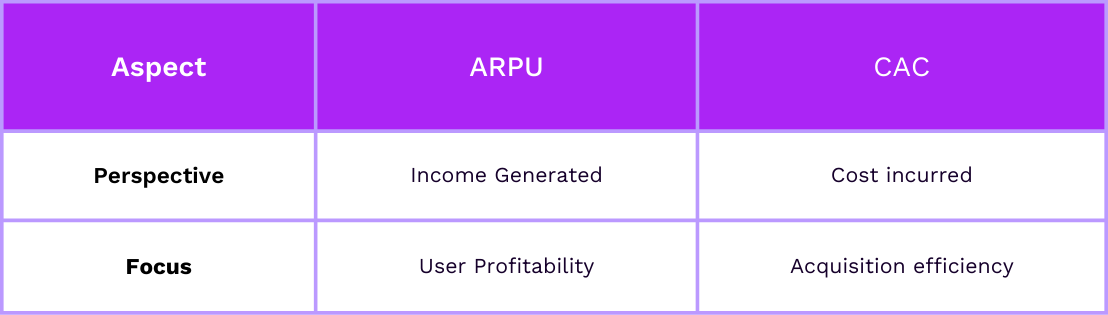
CAC measures the average cost of acquiring a user.
Why link it to ARPU?
- CAC helps us understand whether the indicator is sufficient to cover marketing expenses. If your KPI
- exceeds your CAC, your advertising campaigns are immediately profitable.
- Combined with LTV, it helps determine how long it will take to recover the initial investment.
Differences with CAC:
4. User Engagement (DAU/MAU, sessions)
Analysis of Daily Active Users (DAU) or Monthly Active Users (MAU) is a useful complement.
Why link it to ARPU?
- An increase in DAU or MAU can have a direct effect on ARPU, especially if active users generate more revenue.
- A low connection frequency (sessions) may indicate missed opportunities, even if the KPI is high.
Summary: Why cross-reference these KPIs?
Each KPI provides a unique perspective for a complete analysis:
- LTV: Longevity and future potential.
- Retention rate: Loyalty and commitment.
- CAC: Profitability of advertising campaigns.
- DAU/MAU: Active base and growth opportunities.
Cross-referencing ARPU with these metrics not only enables you to assess current performance, but also to define short- and long-term optimization strategies. By combining this data, you can identify opportunities for improvement and maximize the overall profitability of your mobile application.

Do not hesitate to contact with our teams
Addict can support you to improve your performance.
Conclusion : Pourquoi surveiller votre ARPU ?
ARPU is much more than a simple revenue indicator. It’s a strategic tool that guides you in your marketing decisions, helps you optimize your campaigns and maximize the profitability of your mobile application. Advertisers who master this KPI are better equipped to adapt to an ever-changing market and take advantage of growth opportunities.
💡 Tip: Remember to integrate this metric into your regular dashboards and collaborate with your product, marketing and monetization teams to exploit its full potential.
Want to boost your app’s potential? Contact our team !