Conversion Rate (CVR): a key metric to measure UA performance
Introduction
The conversion rate is one of the most closely monitored KPIs in user acquisition. It provides a concrete way to measure how effectively a campaign turns prospects into active users. Whether your goal is to maximize installs, sign-ups or purchases, this KPI tells you how well your strategy (targeting, creative, landing page, store listing…) is delivering.
But what exactly is the conversion rate? How do you calculate, interpret and optimize it?
What is a conversion rate?
The conversion rate represents the percentage of users who completed a specific action among those exposed to a campaign or digital touchpoint (store listing, landing page, etc.). That action could be an app install, a purchase, a sign-up or even a simple click.
What counts as a conversion depends on the advertiser’s goals, the app’s business model, or even the app category.
For example:
- For a news or media app, a conversion may simply be an install, since the objective is to drive traffic and engagement.
- For an e-commerce app, the install is just the first step. The real conversion is often a purchase, or at least an account creation.
That’s why it’s essential to clearly define what you’re measuring. In UA, the main types of conversion are:
- Click-to-install: how many people who clicked on an ad installed the app.
- Store-to-install: how many visitors to the store page completed the install.
- Registration-to-purchase: in freemium or trial models, how many users actually convert into paying customers.
This KPI helps you assess campaign profitability and spot potential drop-offs in the user journey.
How is conversion rate calculated?
Formula:
Conversion rate = (Number of conversions ÷ Number of interactions) x 100

Example :
A campaign drives 5,000 clicks to a store page and results in 800 installs.
→ Conversion rate = (800 ÷ 5,000) x 100 = 16%
The entry point depends on the type of conversion measured (click, impression, page view…), but the logic stays the same.
What are the average benchmarks?
Conversion rates vary significantly depending on:
- The type of conversion being tracked
- The acquisition channel
- The app vertical
- The country
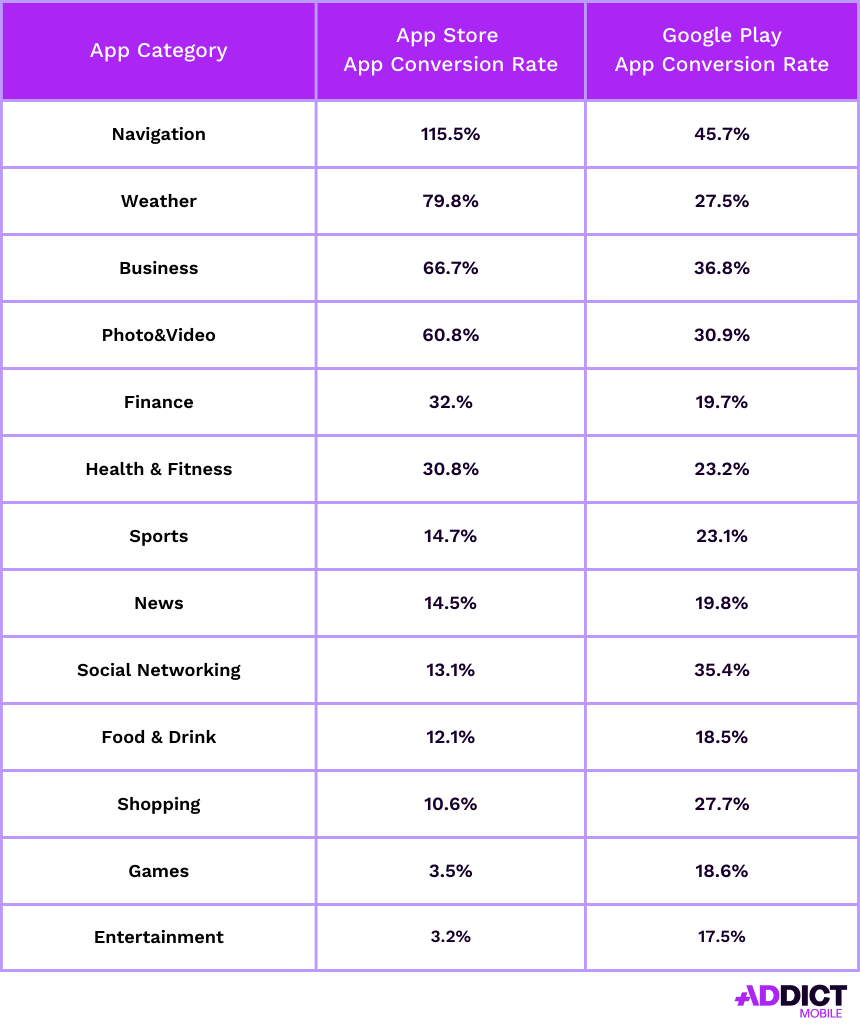
From January to June 2024, the average conversion rate on Google Play in the US was 27.3%. On the App Store, it was 25% for the same period.
Average Conversion Rate by App Category – US (App Store & Google Play)
Why conversion rate matters in user acquisition
In an environment where campaigns run across multiple channels and formats, the conversion rate is a key indicator of what’s really working. It helps measure the effectiveness of each lever, but also qualify the type of users being acquired.
Its strength lies in its ability to span the entire user journey, from click to install, from activation to purchase. It’s a strategic metric that helps identify the most profitable sources, the most engaged audiences, or friction points that need fixing.
When analyzed with care, it becomes a powerful decision-making tool. A lower-than-expected rate might indicate that the message, the creative or even the targeting needs to be reworked, or that there’s a disconnect between the ad promise and the in-app experience.

Do not hesitate to contact with our teams
Addict can support you to improve your performance.
How to improve your conversion rate: 5 Best Practices
1. Improve the user experience from the very first interaction
A good conversion rate starts with the first touchpoint. A slow-loading page, cluttered design, or overly complex onboarding can immediately lead to user drop-off. The goal is to offer a fast, smooth and intuitive experience that guides the user toward the expected action with minimal friction. This means optimizing both the technical performance and the usability of the journey.
2. Adapt campaigns to your target audience
Effective campaigns rely on fine-grained segmentation. It’s not just about speaking the right language, it’s about understanding what each audience expects and adjusting the tone, visuals, cultural references, and CTAs accordingly. The same ad won’t convert in the same way depending on whether it targets a cold user or someone who already interacted with your app. Perceived relevance is a direct driver of conversion.

Discover our tips for UA creatives that convert
3. Track the right KPIs to detect friction points
A global conversion rate can hide deeper issues. By analyzing micro-conversions (click-to-store, store-to-install, install-to-signup…), you can identify exactly where users drop off. Tools like Adjust or AppsFlyer allow you to cross-reference this with behavioral signals to better understand what’s happening. This approach helps prioritize optimization efforts where they’ll have the most impact.
4. Make A/B testing a systematic part of your strategy
Testing shouldn’t be occasional, it should be part of your overall process. The goal isn’t to test everything at once, but to prioritize the highest-impact elements: visuals, headlines, formats, CTAs. Once the best-performing assets are identified, refine and iterate. Testing isn’t an end in itself, it’s a continuous improvement lever, rooted in learnings.
5. Re-engage users who didn’t convert
Not all users convert right away. Targeting those who clicked but didn’t install, or installed but didn’t complete the journey, helps recover conversions at a lower cost. An effective strategy relies on good timing (a few hours or days after the drop-off) and a message that’s helpful, personalized, and non-intrusive. In some cases, a limited-time offer can be enough to win over a hesitant user.
Conclusion
Conversion rate is more than just a percentage, it’s a compass for your UA strategy. Combined with other KPIs like CPI, ROAS, or CPM, it offers a more complete view of performance. By understanding what impacts it and activating the right levers (UX, targeting, creatives, testing, tracking, and re-engagement), you can boost your results and enhance the overall user experience.